Note: Full Github repository with code and databases used in the project available here
Introduction
Jose is a 19-year-old guy who lives in a marginalized neighborhood from a high inequality country. Currently, he works at a small local supermarket and has been working there for three years before he dropped out of school because he needed to support his family. His family is small, and Jose doesn't have a father. Actually, he even did not get to know him because his fathers left his mother when she was pregnant.
Jose always punched out at 10 PM when the supermarket closed. One day, Jose did not make it home, as usual, there was a shooting in his neighborhood between the police and criminals involved in drug trafficking, on his way from work to home, and Jose ended up being a victim of a stray bullet.
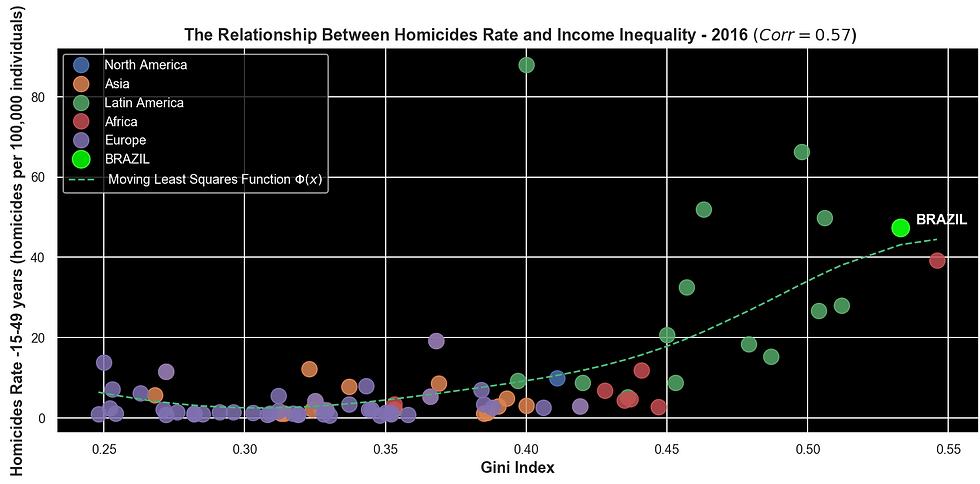
According to this chart that shows the correlation between homicide and inequality, can you guess which country Jose comes from?

I'd say that most people would point to LATAM country as the correct answer. I can't speak for other countries, but I can ensure if you tell this story to Brazilians, they won't be surprised. 14 cities in Brazil are among the 50 most violent cities in the world (2018) [1], after all.

Tragic stories like Jose's are common in Brazil, especially, if the victims are between 15 and 29 years old, as you can notice in the chart below. In 2017, homicides of 15-29 years people account for 51% of total numbers.

Maybe you got to thinking these incidents are distributed across the country. Well, they are distributed, but not uniformly, 14.1% of the cities account for 76% of the total number of homicides, and the number of cases in 27 capitals of the country represents 25.8% of the total.
They are not just statistics. They represent tragic losses of life of young people who did not even reach the age of 30, the stories of parents and friends grief' if the victim has had someone special at least. Collectively, many sad and violent stories set up a fearful and unsafe environment that torments the routine of lots of people.
What is the origin of all this, and how can we lessen and mitigate it? I would like to discuss a little more about that from an economical and educational viewpoint.
Eliminating the problem
In order to further understand the problem and what could affect the violence, we compare homicide rates data with human development data to offer a clue about the causality (correlation does not imply causality):

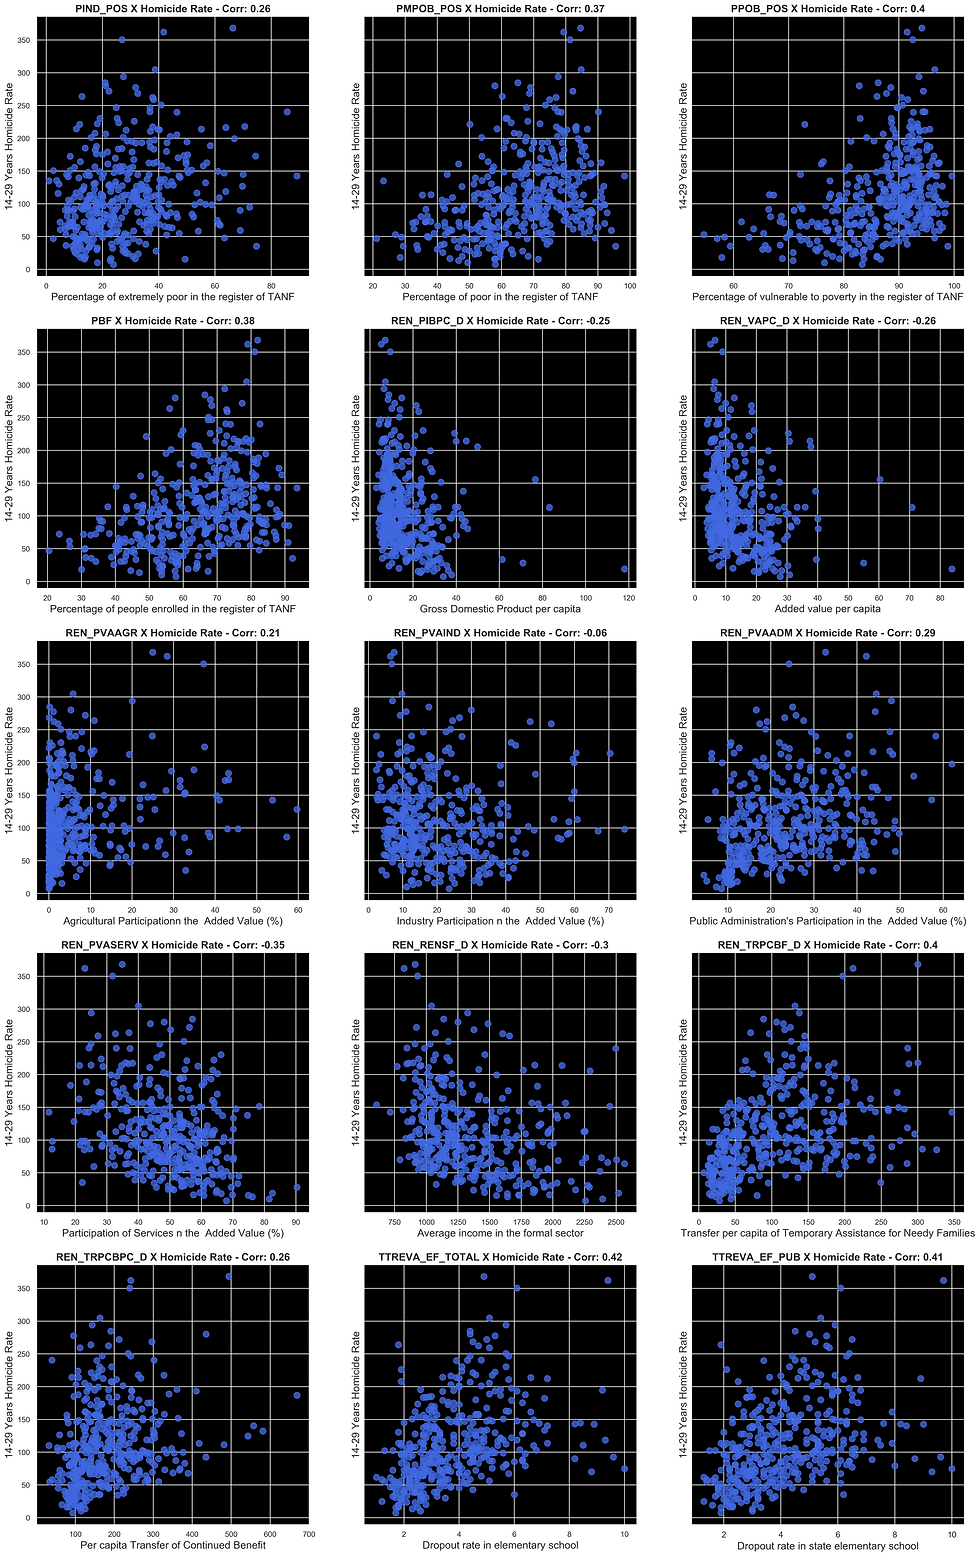
To complement the correlation matrix, it would be helpful to visualize the relationship between homicide rate and other variables with more details by creating multiple scatterplot graphics.

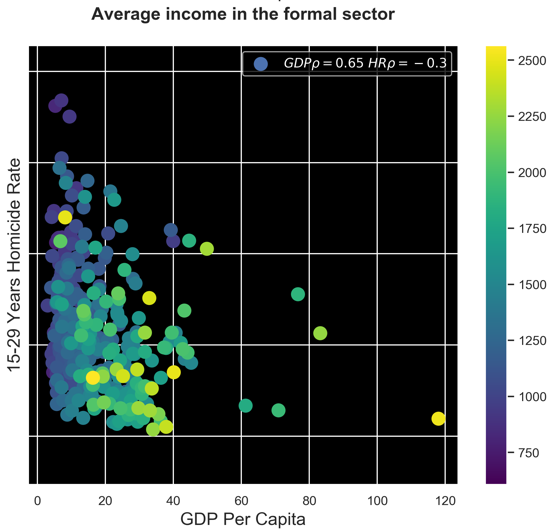
Furthermore, we can generate a scatterplot to simultaneously assess three variables at once. Then we fixed GDP per capita and the homicide rate. For each scatterplot, the color gradient represents the variable labeled on the title, and the legend shows the correlation. We can extract some insights from them:

There's a horizontal gradient, showing that GDP declines since the cities depend more on economic activities that have arisen from the public administration.
The correlation between GDP per capita and value-added of public administration is strongly negative: 𝜌 = -0.71
We can note a lower contrast in the vertical gradient, which indicates that the value-added doesn't much vary for an interval of GDP per capita. There is more dependence on public administration for wealth generation, 𝜌 = 0.29
Those considerations find evidence in the CNM survey, showing that a significant part of the cities depend on the GDP coming from the public administration activities and, these cities are more localized in the Northeast, the poorest region in Brazil [2].

At the vertical gradient, we can see the per capita transference of TANF (Transfer per capita of Temporary Assistance For Needy Families - It's called Bolsa Família in Brazil) increases as the homicide rate rises, 𝜌 = 0.41
There's a notorious horizontal gradient where we can look at the transfer of Bolsa Família decreasing while GDP per capita is increasing, 𝜌 = -0.49
It shows us there is no evidence that the welfare benefits distributed by the government can mitigate the number of murders.

At the vertical gradient, we can notice the average income diminishes while the homicide rate goes up. A significant Spearman correlation is noticeable: 𝜌 = -0.3.
Among all variables, the highest positive correlation between the GDP per capita is the average income in the formal sector, pointing out a 65% correlation.

The fact of cities with high school dropouts indicating a low GDP per capita and a high homicide rate gets the attention. That converges to the following research: the classic correlation between mean years of schooling and GDP per capita [3].
For school dropout rate, the correlation between GDP/person and homicide rate is 𝜌 = -0.42 and 𝜌 = 0.41 respectively.
GDP per capita is an important variable but is a complex one since many other factors can affect it. Let's replace that with the average income.

Much like GDP per capita, the Average Income reveals to have strong correlations with Dropout rates in State (Public) Elementary Schools.
Curiously, the correlation between GDP per capita and Avg. Income is way stronger for a socioeconomic comparison, 𝜌 = 0.65
For school dropout rate, the correlation between Average Income and Homicide Rate is 𝜌 = -0.40 and 𝜌 = 0.41 respectively.
It's fair to say that some variables seemed more correlated with homicide rates, as well as more correlated among themselves:

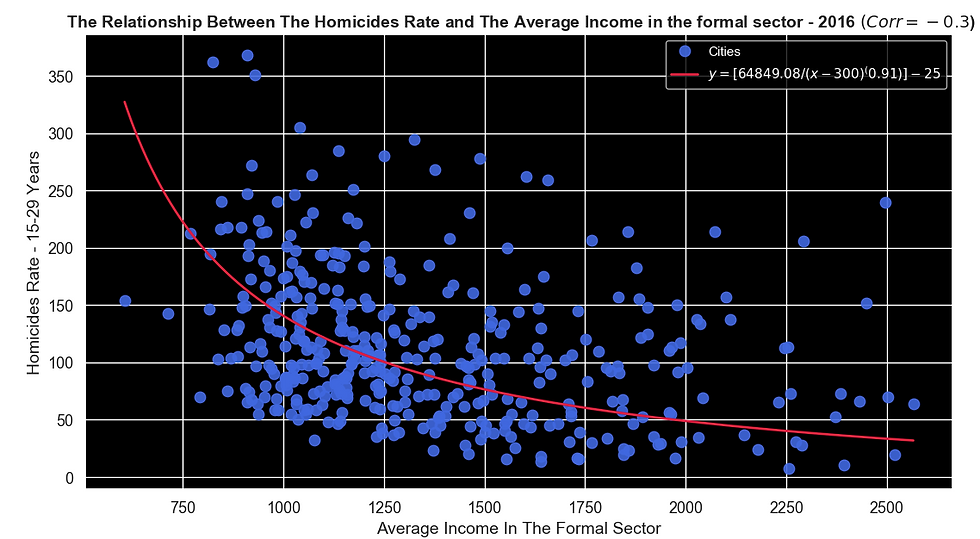
As far as we're concerned, the average income in the formal sector is more controllable than the GDP per capita, so let's use non-linear regression to find a predicted model between those two:

Owing to the lower model coefficient of determination, 𝑅2 = 0.11, we can set prediction intervals to ensure that the values predicted by the model will be between a range, with significant confidence. A prediction interval for linear regression depends on the predicted values of the model, the dependent variable, and its standard deviation. However, our model is non-linear, then we could try to calculate different prediction intervals for many points of the predictor variable. First of all, we group the average income into four chunks:

We compute four 95% prediction intervals (PI) for the same model, considering different standard deviations of Y for four sections of X values. Posteriorly, we apply Newton method to interpolate all points of PI and get a continuous equation of PI.

Finally, we have our regression model and a sophisticated dynamic prediction interval.


Validating the model, we realized that 94.5% of points were within the interval, being close to 95%, which is acceptable.
According to our model, if we increase the average income in the formal sector by 100 BRL in a random city, where there are 800 homicides per capita, we can reduce the homicide rate down by 28 deaths to 40 deaths per 100 habitants with 95% confidence. Even though the model has a low accuracy (𝑅2=0.11), I can ensure how often the homicide rate predicted will be into a range of values, given the average income in the formal sector from a random city.
Conclusion
We could hypothesize Jose's city has high violence rates, as well as a high dropout in the public elementary school, high transference of TANF, and low average income in the formal sector. We could also say the public administration participation in the city economy is the majority. They are statistically good shots. In fact, increasing the average income would not avoid tragedies due to violence, but it would decrease tragic outcomes such as Jose's, and one day those might not be common anymore for people.
References
3. https://ourworldindata.org/grapher/correlation-between-mean-years-of-schooling-and-gdp-per-capita
Comments